A few weeks ago I co-organised and participated in a #monitoringlove sprint in Berlin.
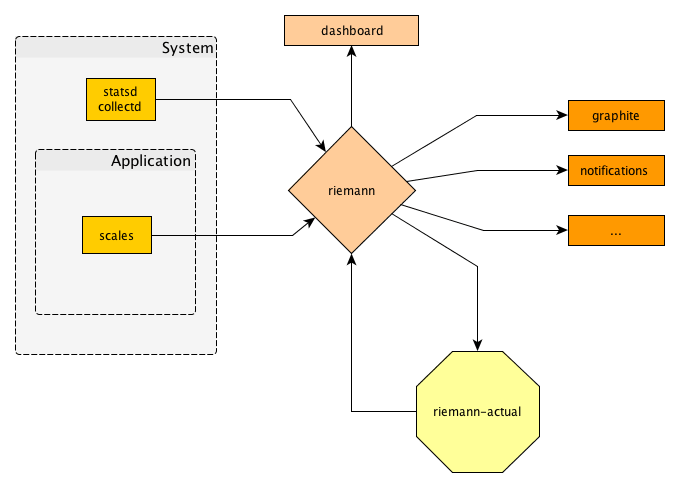
My personal plan was to play with more modern utilities that can potentially replace our existing Nagios monitoring chain. The result of what I think would be a good setup would probably look like this:
Most of those parts already exist. The new thing in there is what I called “riemann-actual” – something that generates new events based on existing events from the index. I call this “higher order” monitoring – in Nagios these would be known as “business processes”.
The word “business processes” is a bit misleading as nothing is really about processes there: it means taking previously taken monitoring data and subsuming it into a more dense expression. Ideally you can recombine any of your metrics to make an overall statement of “everything is good if more than 80% of the appservers are up and we have less than 5% of error response rate and the frontpage is reachable from at least 3 outside systems”.
Data gathering
First, I tried to setup something for data gathering. I already got the recommendation to look at scales for in-app metrics and found it easy to get started. I like the notion that metrics in your app behave a little bit like logging: you don’t care where they go and you expect the user of your system to configure an actual target. The built-in webserver is nice to get started and graphite as a protocol seams fair enough nowadays to forward data.
To gather system-level metrics I guess both collectd and statsd are fine points to start from. I used collectd to begin with as it actually had a riemann output plugin.
Central processing
We want to be able to take all of the data we acquire into account on making decisions quickly. Riemann seems to be the most suitable tool for this task. After playing around for a while trying to implement “business process” monitoring in clojure I found it easier to provide a Python-environment that can talk to riemann and do those decisions. I made this available as “riemann-actual” on bitbucket.
I noticed that this setup would require only a very generic riemann configuration and could perform on a per-customer or per-project basis by just adding more of those loops on top of riemann.
Performance-wise I was extremely happy. I could have a 10Hz monitoring loop resulting in about 1k events per second on my computer. With that resolution all business processes would notice an outage with no visible delay.
A nice feat is that Riemann can generate events when old events reach their TTL. This way you can make sure that you notice when a system you are monitoring “goes dark”.
Also, it seems that Riemann configuration can be unit-tested easily: feed events in, watch the index, or see events coming out. It doesn’t get much simpler than that.
The configurable dashboard in Riemann 0.2 is already very helpful: responsive, flexible, and fast – until you try to display 10k metrics at once. 😉 It needs a little more finishing but it’s on a good way.
Distributed consumers
My understand of Riemann is that it wants to be a nexus for “central, volatile, shared state”. This means you get a lot of updates going through and that it needs to be good with I/O. OTOH it means that it shouldn’t do much and just make it easy for you to router your data somewhere else.
Actually looking at further consumers didn’t happen as 3 days aren’t that long. 🙂 I see graphite on the horizon (with the setup becoming easier over time) as well as more custom tooling to turn events into notifications, etc.
A look at OpenTSDB seemed promising at first but it turns out to have an even more complex setup requirement than graphite. I got it running but it seemed extremly hard to control, so I dropped it after a few hours.
Overall it seems that since the outcry of #monitoringsucks a lot has happened and I’m faithful that there’s a way out of Nagiosland in the near future.
More notes from our sprint are available at pysprints.de. (Although in German.)
